
Addressing the skew problem
Practical implications for addressing negative skew in investment portfolios
How do we deal with the skew problem?
Our paper on the effect of skew on portfolio efficiency identified that negative skew, where it occurs, is a result of different volatilities in the downside and upside market return distributions. The higher volatility on the downside creates a negative skew effect that has the effect of lengthening recovery time.
This says little about what specifically to do, and indeed in which asset class or classes to do it. The purpose of this paper is to address these questions.
Ultimately, we are concerned with improving the skew of a portfolio at multiple time horizons. We identified earlier that diversification does not really help us here. Nonetheless we are supportive of diversification given its benefits in other areas – for example, generally the stability of longer-term returns is improved through diversification, and that is a helpful effect. So we are not suggesting throwing the baby out with the bathwater and abandoning the concept of diversification. Rather, we are acknowledging that, while diversification solves some problems, it creates another that it cannot solve – we call this the “skew problem”. This needs to be addressed in a different way.
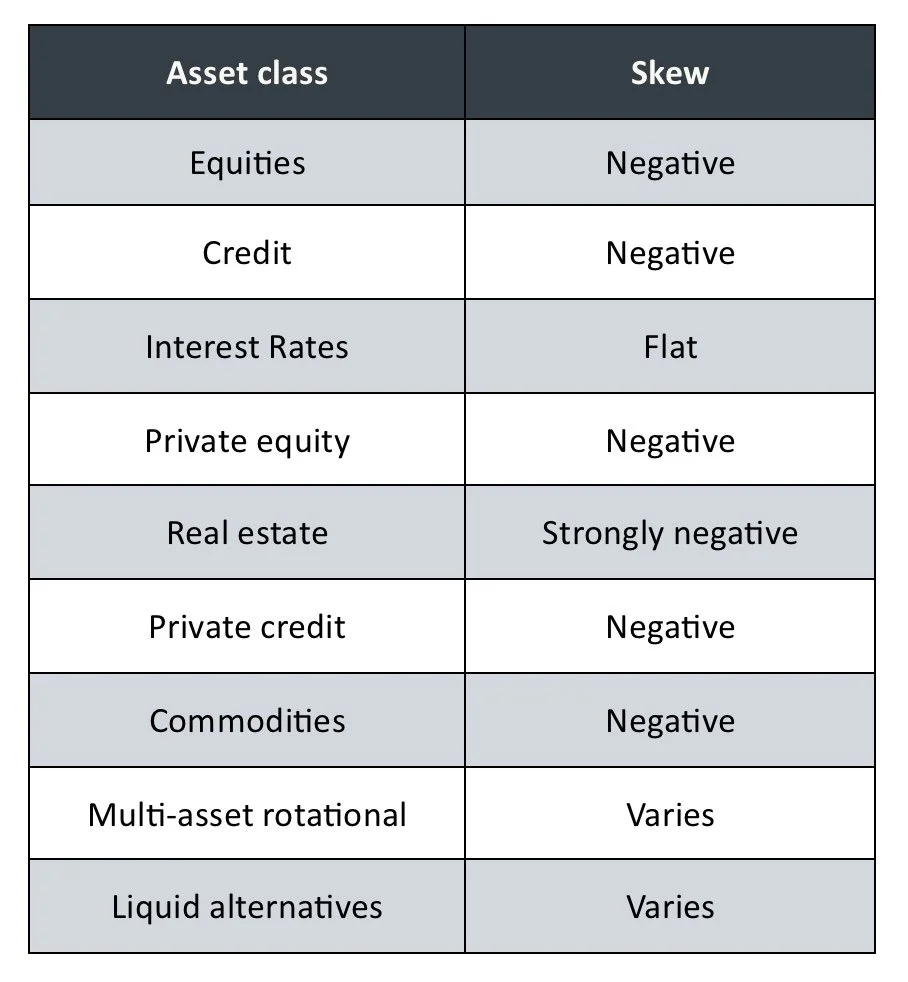
In a typical diversified investment strategy, we may find the following types of investment in various allocations. We identify next to them the direction of skew.
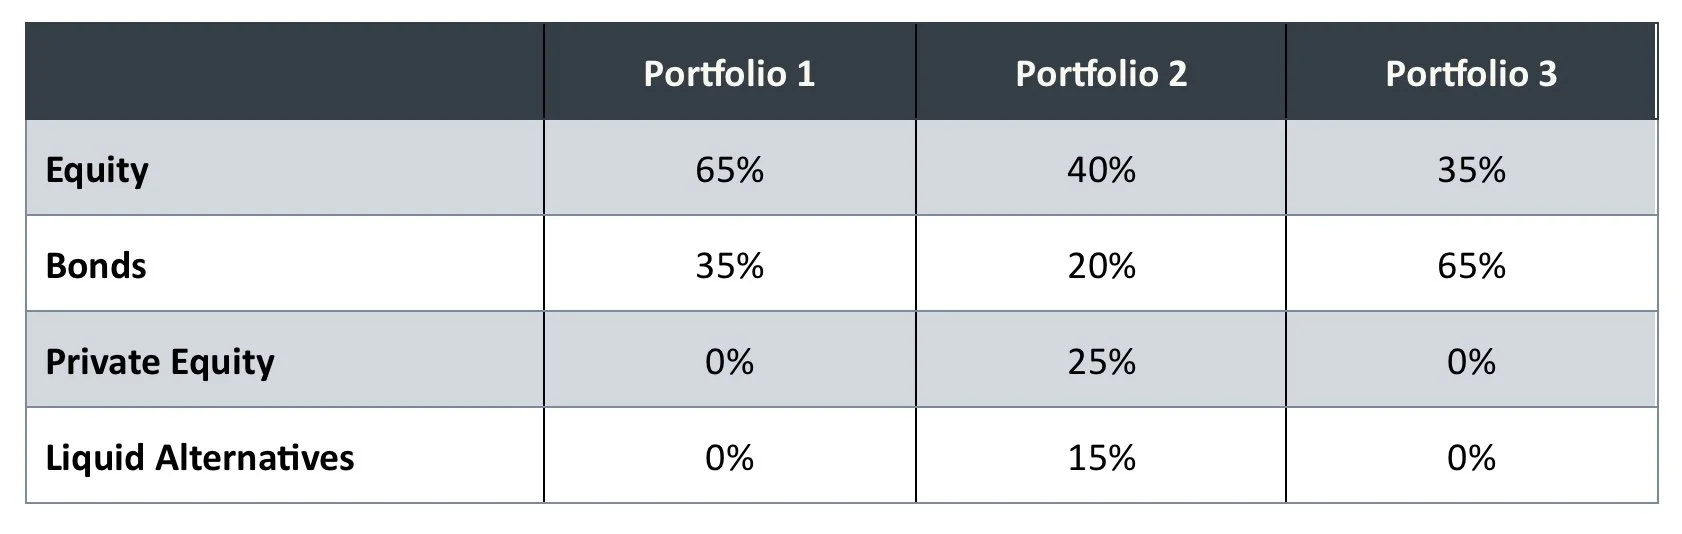
It is helpful to consider what the biggest contributors to the negative skew problem are, within a portfolio, and what we might be able to do about it. To do this, we consider three different types of portfolios.
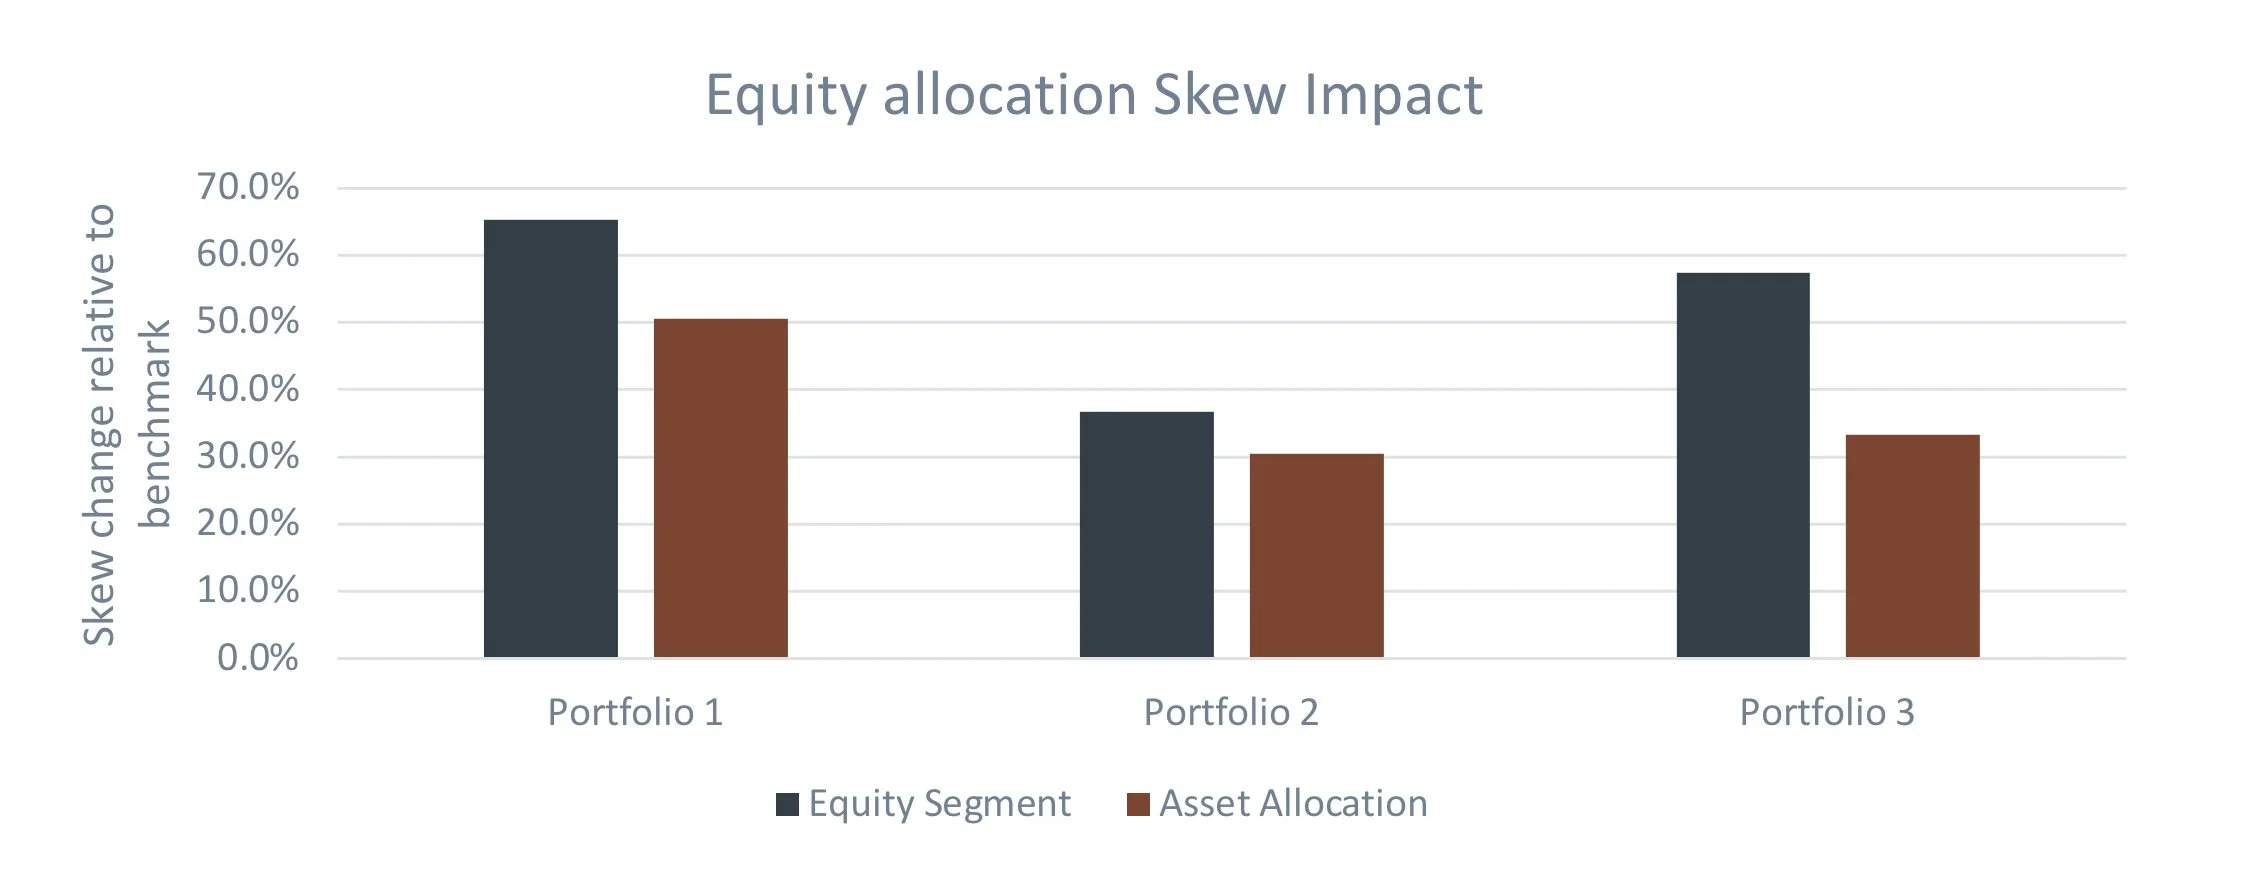
The chart below shows the impact of neutralizing the skew on three asset types separately – public equity, private equity, and credit. So for example, if we neutralize the skew of the equity allocation in Portfolio 1, it improves the overall skew of Portfolio 1 by around 55%.
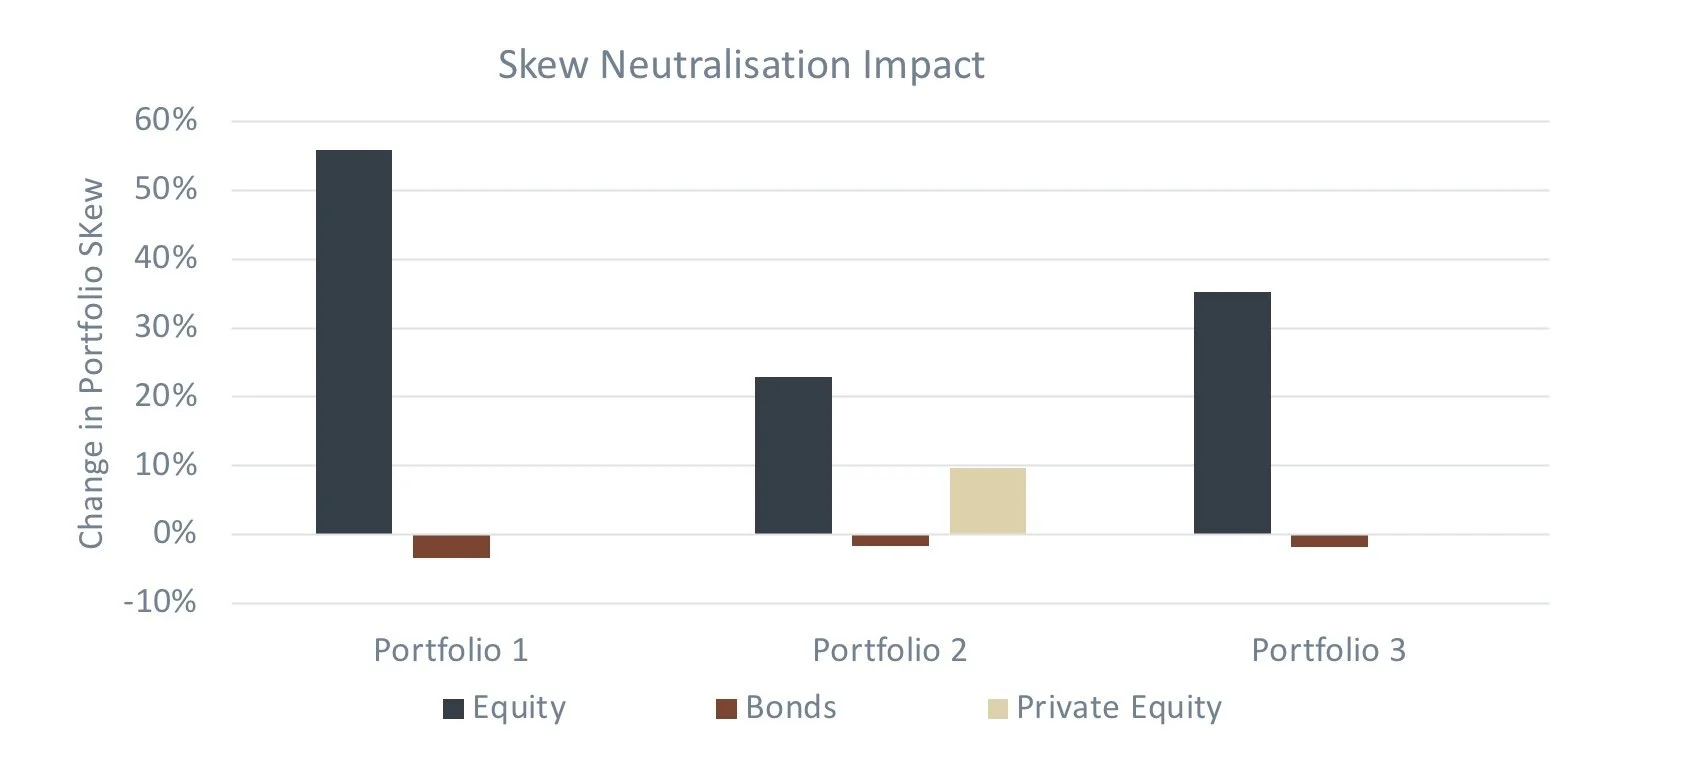
Source: PEP, Bloomberg. Equity represented by S&P 500 in USD. Bonds by Bloomberg US Agg Total Return Value Unhedged USD. Private equity and liquid alternatives calculated by PEP. All performance taken from 03/31/2003 to 09/30/2023. Past and simulated performance is no indication of future results.
As can be seen, the benefit of neutralizing the equity skew is greatest in all strategies, even in Portfolio 3 where the equity allocation is relatively low. Neutralizing equity skew also has a significant effect across all horizons. The following chart shows the effect of neutralizing the skew of the equity portfolio for all 3 portfolios, over multiple time horizons.
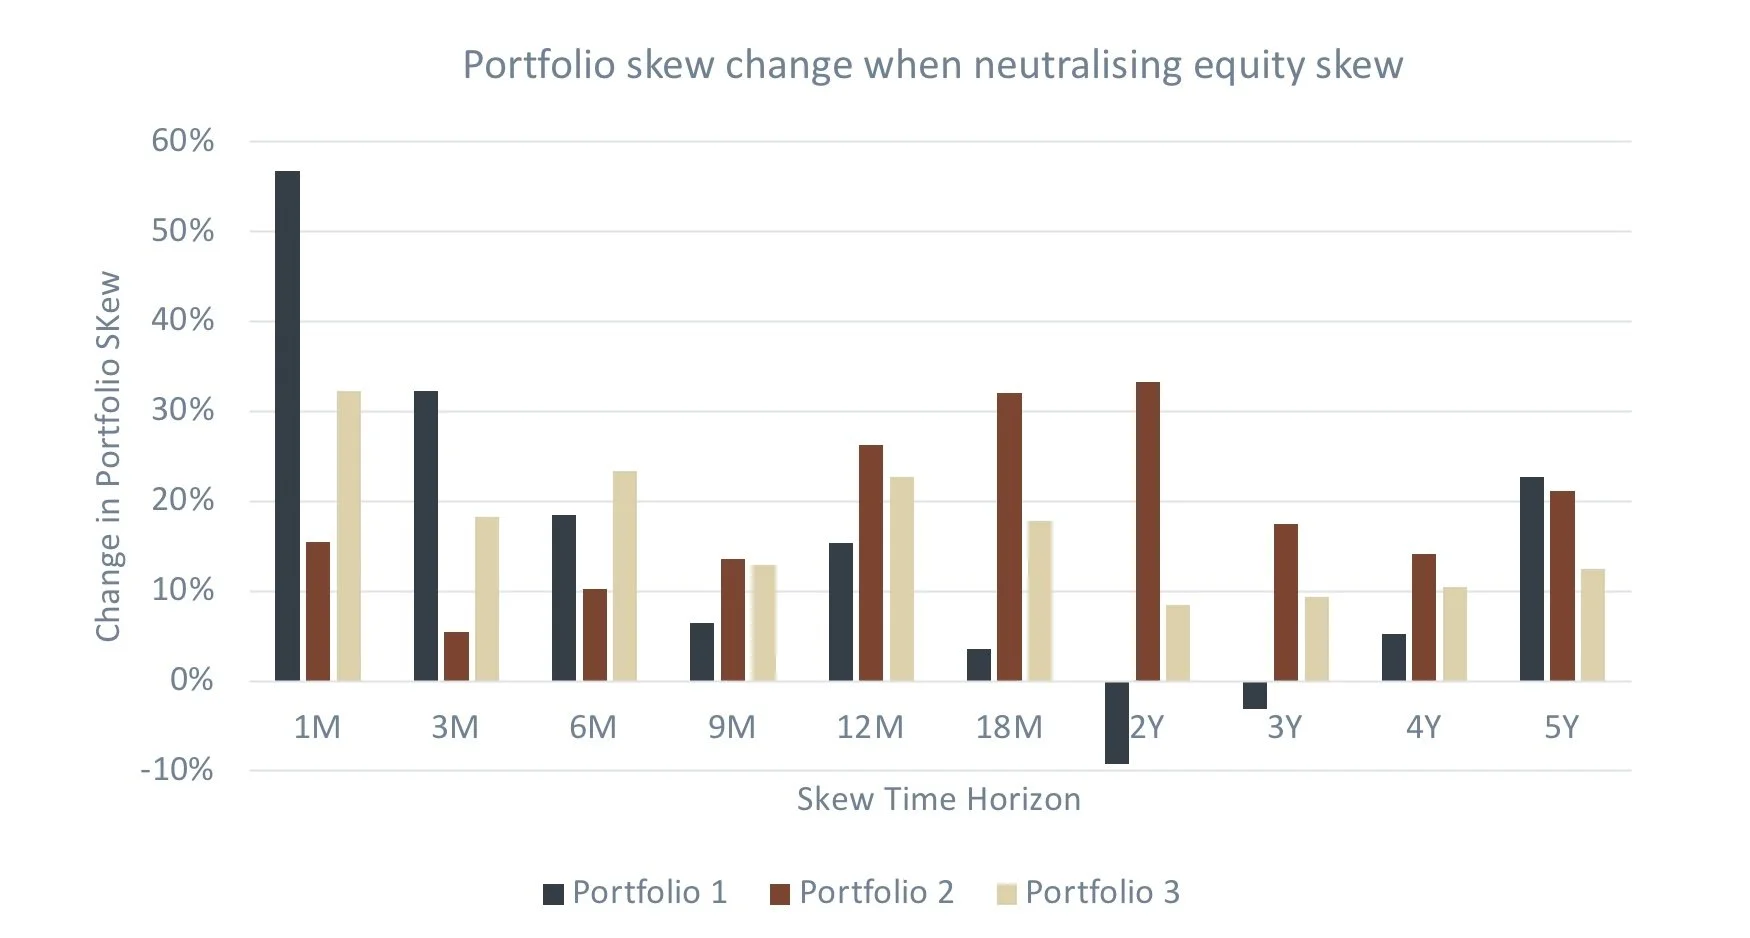
Source: PEP, Bloomberg. Equity represented by S&P 500 in USD. Bonds by Bloomberg US Agg Total Return Value Unhedged USD. Private equity and liquid alternatives calculated by PEP. All performance taken from 03/31/2003 to 09/30/2023. Past and simulated performance is no indication of future results.
What this analysis shows is that, in the majority of situations, the skew problem is most effectively addressed WITHIN the public equity portfolio. The reason for this is because a) skew is generally more negative in equities than other classes (except credit) and b) equity volatility tends to dominate portfolio volatility (even at relatively low weights).
To put this in more general terms, investors should prioritize tackling negative skew in assets that:
a) Contribute most to overall portfolio volatility AND/OR
b) Have the most negative skew in isolation.
For the vast majority of investors this therefore means that the skew problem is primarily a public equity problem.
So, after addressing the skew problem via equity, do we get all the expected benefits of the neutralized skew at an overall portfolio level? The below table shows how even in the portfolio least heavily weighted to equities (Portfolio 3 with 35% Equity, 65% bonds), we still get outsized improvement from only focusing on the skew in public equity allocation.
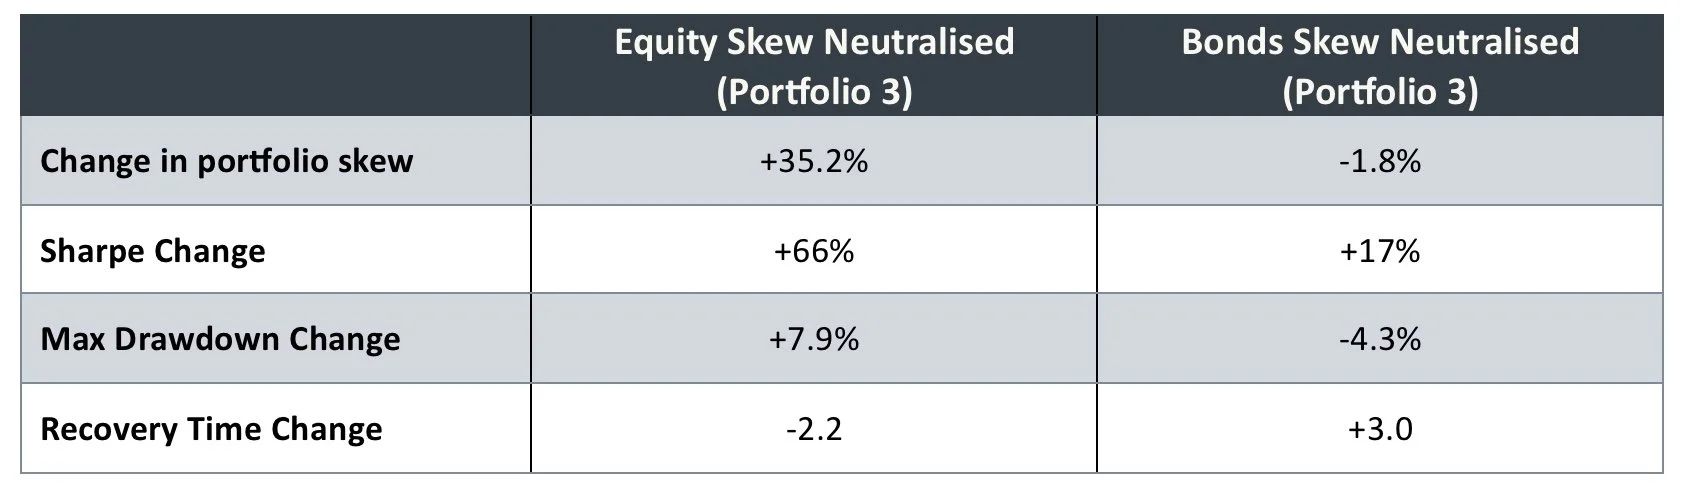
Source: PEP, Bloomberg. Equity represented by S&P 500 in USD. Bonds by Bloomberg US Agg Total Return Value Unhedged USD. Private equity and RV taken from based on output from PEP’s proprietary models. All performance taken from 03/31/2003 to 30/09/2023. Past and simulated performance is no indication of future results.
Drawdowns and recovery times are both improved when addressing equity skew, something that can’t be said for doing the same to the bond allocation.
Approaches to solving the public equity skew problem
The first question is – do any equity segments or factors naturally exhibit the right kind of characteristics?
In short, the answer is no.
The table on the right shows the historic skew for a range of equity factors, segments and indices. Clearly some equity segments do have better skew than the broad market (S&P500) over the long run. It’s fair to say though that even those with the highest skew (e.g. our own US Quality portfolio) are still meaningfully negative. These aren’t close enough to neutral to have a worthwhile impact portfolio level skew if held throughout the cycle.
Now, this list is by no means exhaustive, but as far as we know, there are no “buy and hold” equity approaches that can address the public equity skew problem.
The only way to have a big enough impact on the upside and downside distributions is to adjust portfolio allocations in a way that is consistent with the prevailing macro environment.
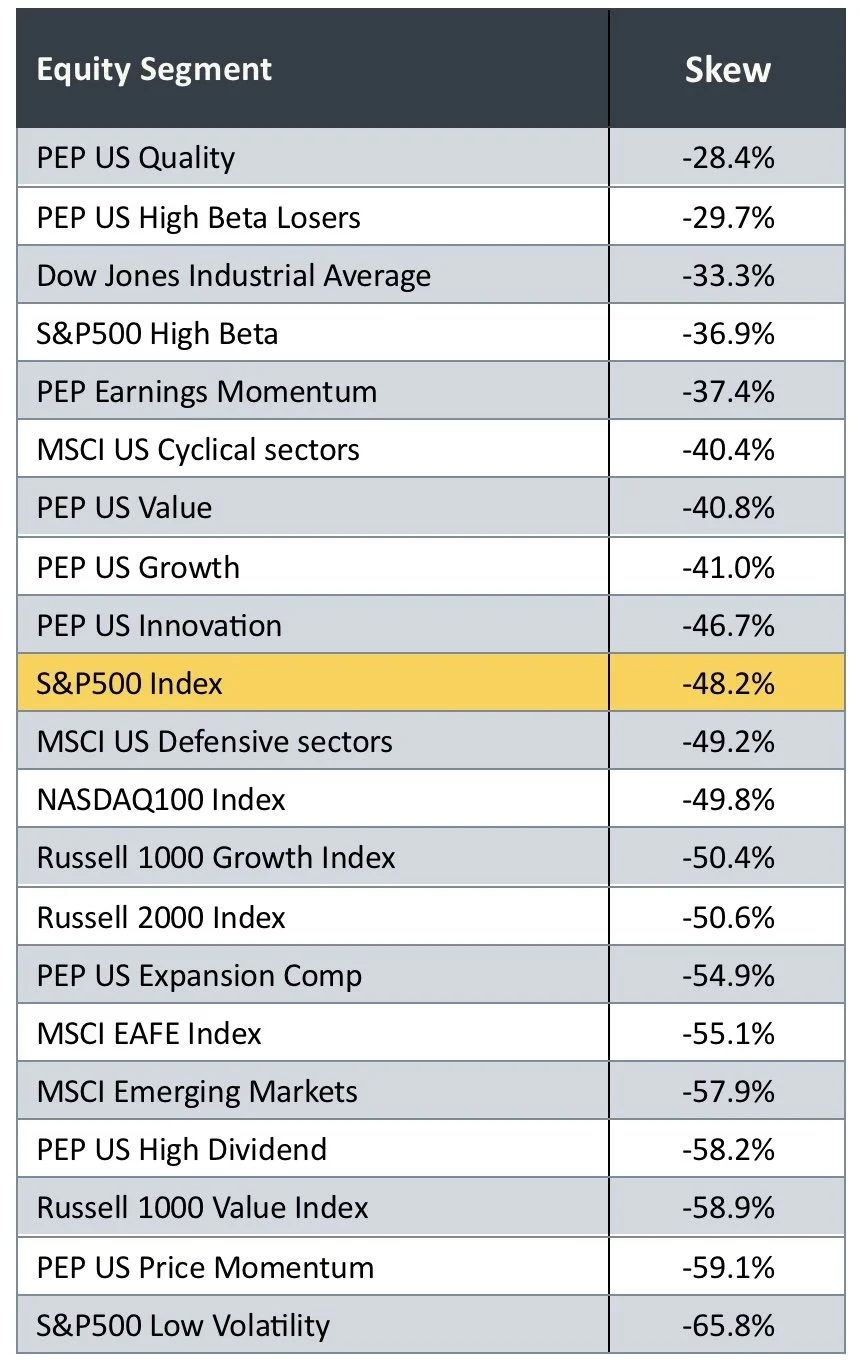
Source: PEP, Bloomberg. All returns in USD from 01/01/2000 to 05/31/2024. Past and simulated performance is no indication of future results.
The solution requires a dynamic approach
Earlier we identified that the most effective way to address skew in general is to at least maintain the Sharpe ratio of the downside and upside distributions, while reducing volatility on the downside and increasing it on the upside. Looking first at the downside distribution – there are two obvious ways to achieve this:
· Invest in a way that adds alpha and reduces volatility. Allocating to quality or defensive equities in contraction environments will tend to achieve this.
· Being under allocated to equities in contraction environments will achieve this by definition, as it cuts the volatility while maintaining the Sharpe ratio.
Addressing the upside distribution is not always as straightforward. This is because the Sharpe ratio of the market is already high on the upside, making it very difficult to add risk to a portfolio without reducing Sharpe. Therefore, care needs to be taken to ensure that the approach to choosing equity segments and strategies is both consistent with the environment and is achieved in way that doesn’t put so much tracking error into the portfolio that it reduces the Sharpe ratio within equities.
We illustrate the above principles through the following assumptions:
· Equity Segment approach: allocate between 5 major global indices according to our seasonal investment framework
· Asset Allocation approach: Underweight equities by 50% in defensive phases (overweight cash to offset) and benchmark weight equities the rest of the time. Equity invested in the S&P500.
The following chart shows the effect on skew of the three portfolio strategies identified earlier but using the above approaches to manage the equity allocation.
Source: PEP, Bloomberg. Equity represented by a combination of the S&P 500 in USD and PEP’ proprietary equity portfolios in USD. Bonds by Bloomberg US Agg Total Return Value Unhedged USD. Private equity and liquid alternatives calculated by PEP. All performance taken from 03/31/2003 to 09/30/2023. Past and simulated performance is no indication of future results.
As can be seen, applying this approach to management of the equities significantly improves portfolio skew, and by extension, the recovery time.
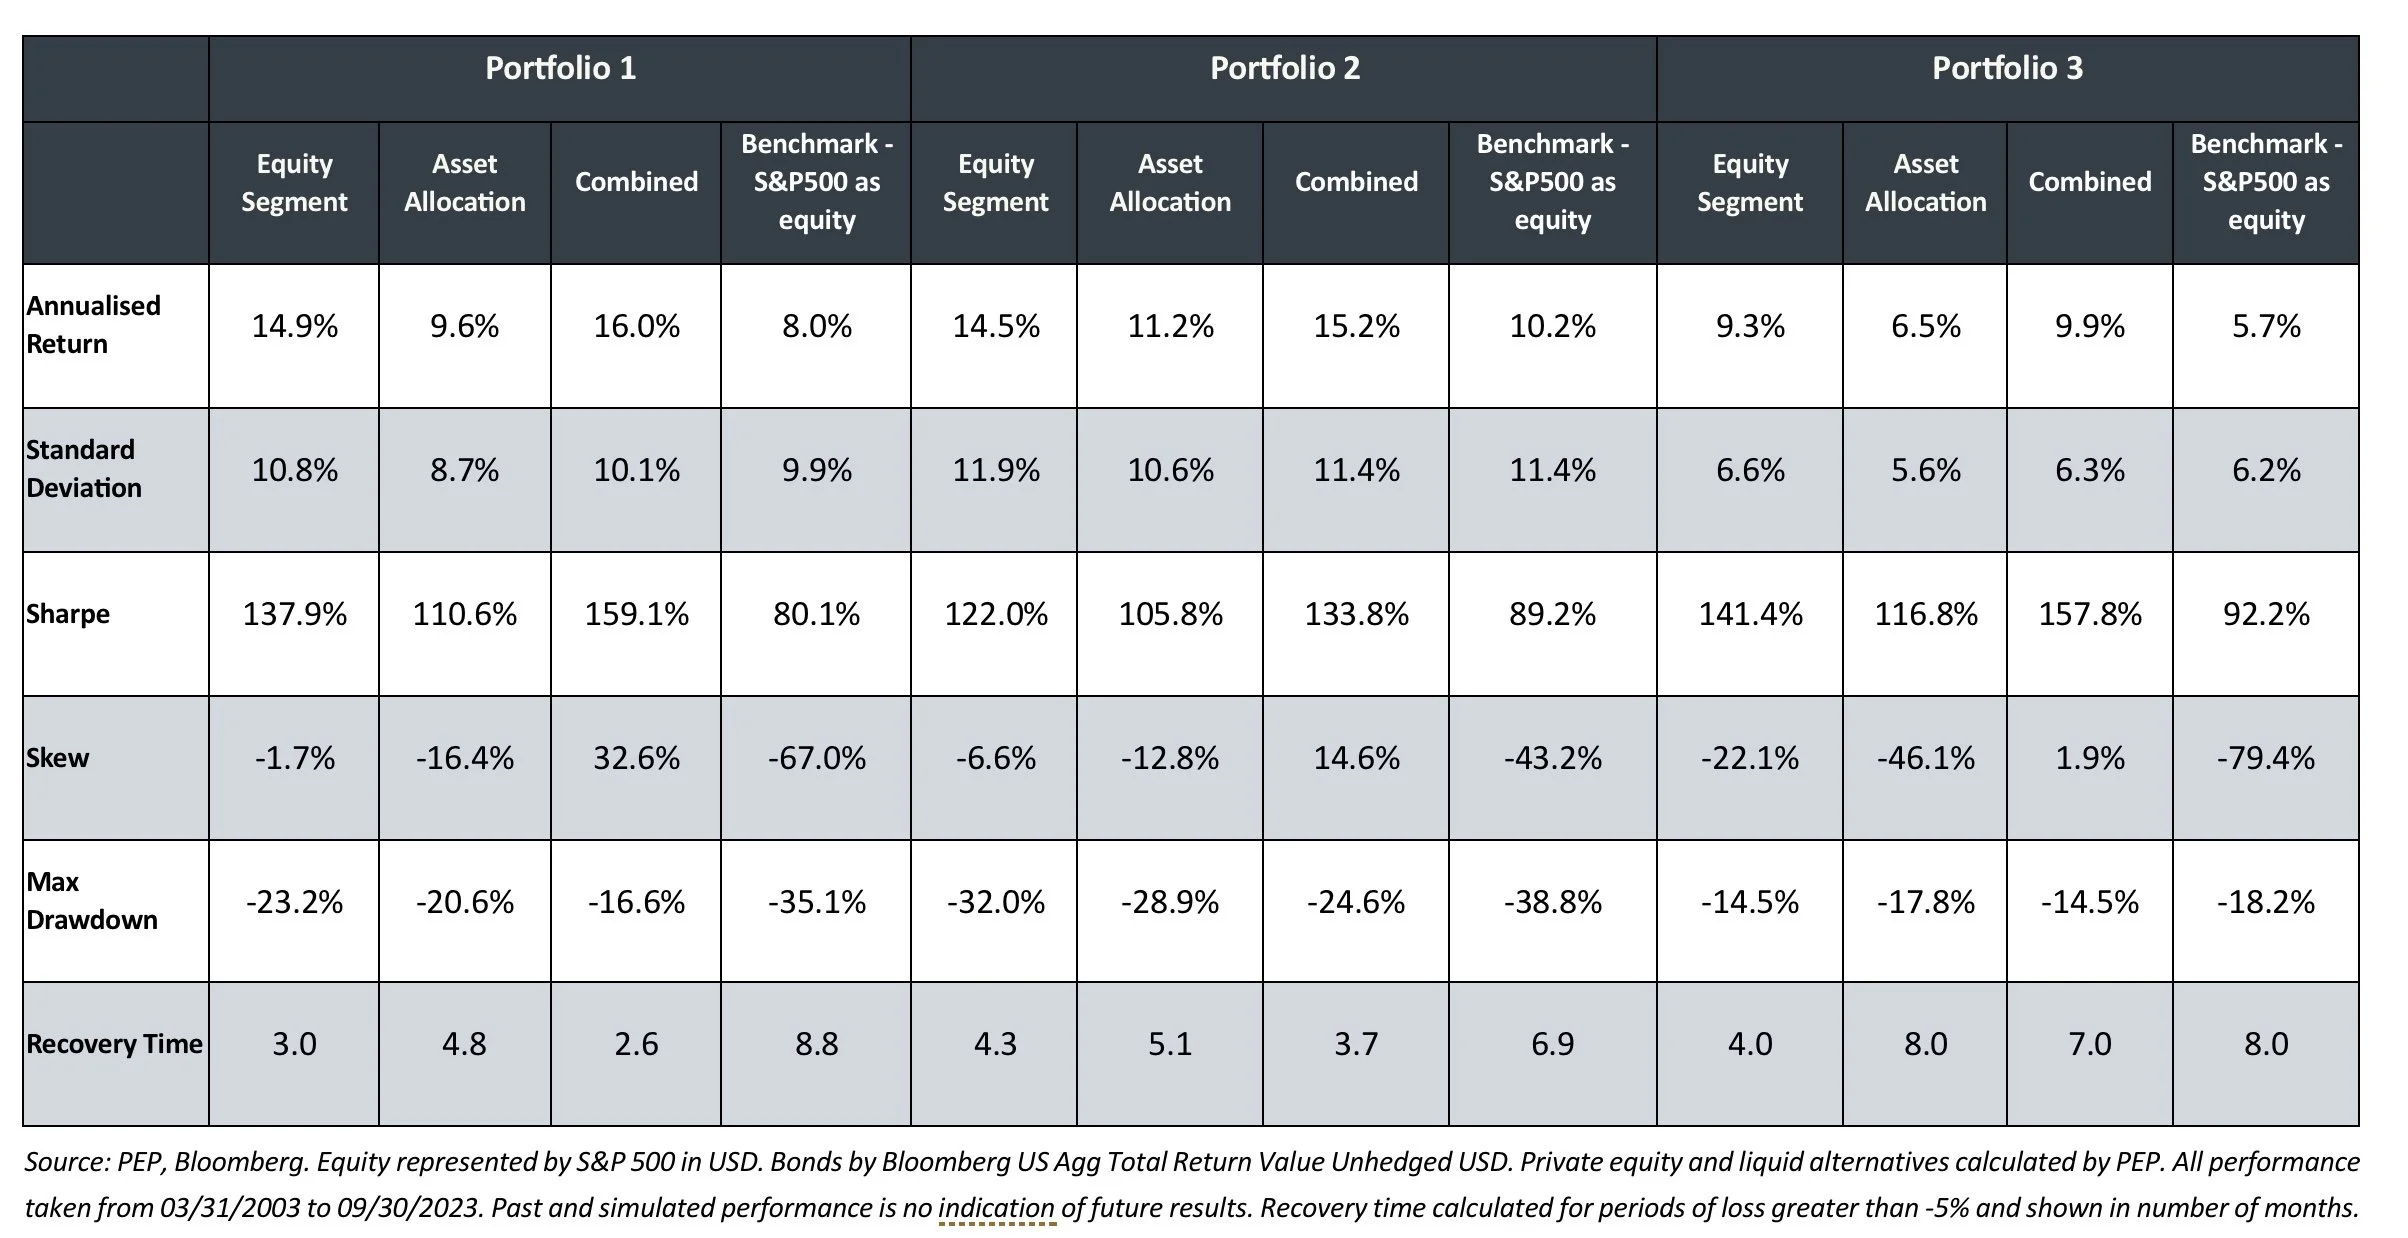
The table on the following page shows a more complete set of statistics for these portfolio combinations. We also compare a combination of the two proposed approaches.
There are a lot of numbers here, but the broad conclusions are as follows:
1. Both approaches produce significant improvements in portfolio characteristics across a range of measures - efficiency, skew, recovery time and maximum drawdown
2. Focusing on equity segment selection generally has a greater impact on outcomes albeit with higher volatility.
3. A combination of the two approaches yields the best of both worlds, with higher returns, greater Sharpe and lower downside risk.
A simple solution to the skew problem
While we believe the skew problem is best addressed through a combination of asset allocation and equity segment allocation, each approach individually also has merit.
Here we propose a solution using our own intellectual property. We believe this represents a realistic, simple and low-cost solution to the skew problem in public equities.
The conditions are as follows:
· Under-allocate to the S&P500 in contraction periods
· Over-allocate to the S&P500 in expansion periods
· Neutral S&P500 in balanced periods
· Over long run equity exposure equal to 100%
· Skew close to zero
The solution to these parameters, according to our macro framework is as follows:
· 62.5% exposure to the S&P500 and 37.5% exposure to cash in contractions
· 125% exposure to the S&P500 in expansions
· 100% exposure to the S&P500 in balanced
The analysis below shows the results of this portfolio. In summary:
1. Neutralizing skew is worth at least 5% p.a. in extra return for a similar long-run volatility.
2. The biggest risk improvement is seen through recovery time which is under half that of the broad market. To put that into context, an investment in the skew neutralized index spends less than half as much time recovering from losses than the broad market.
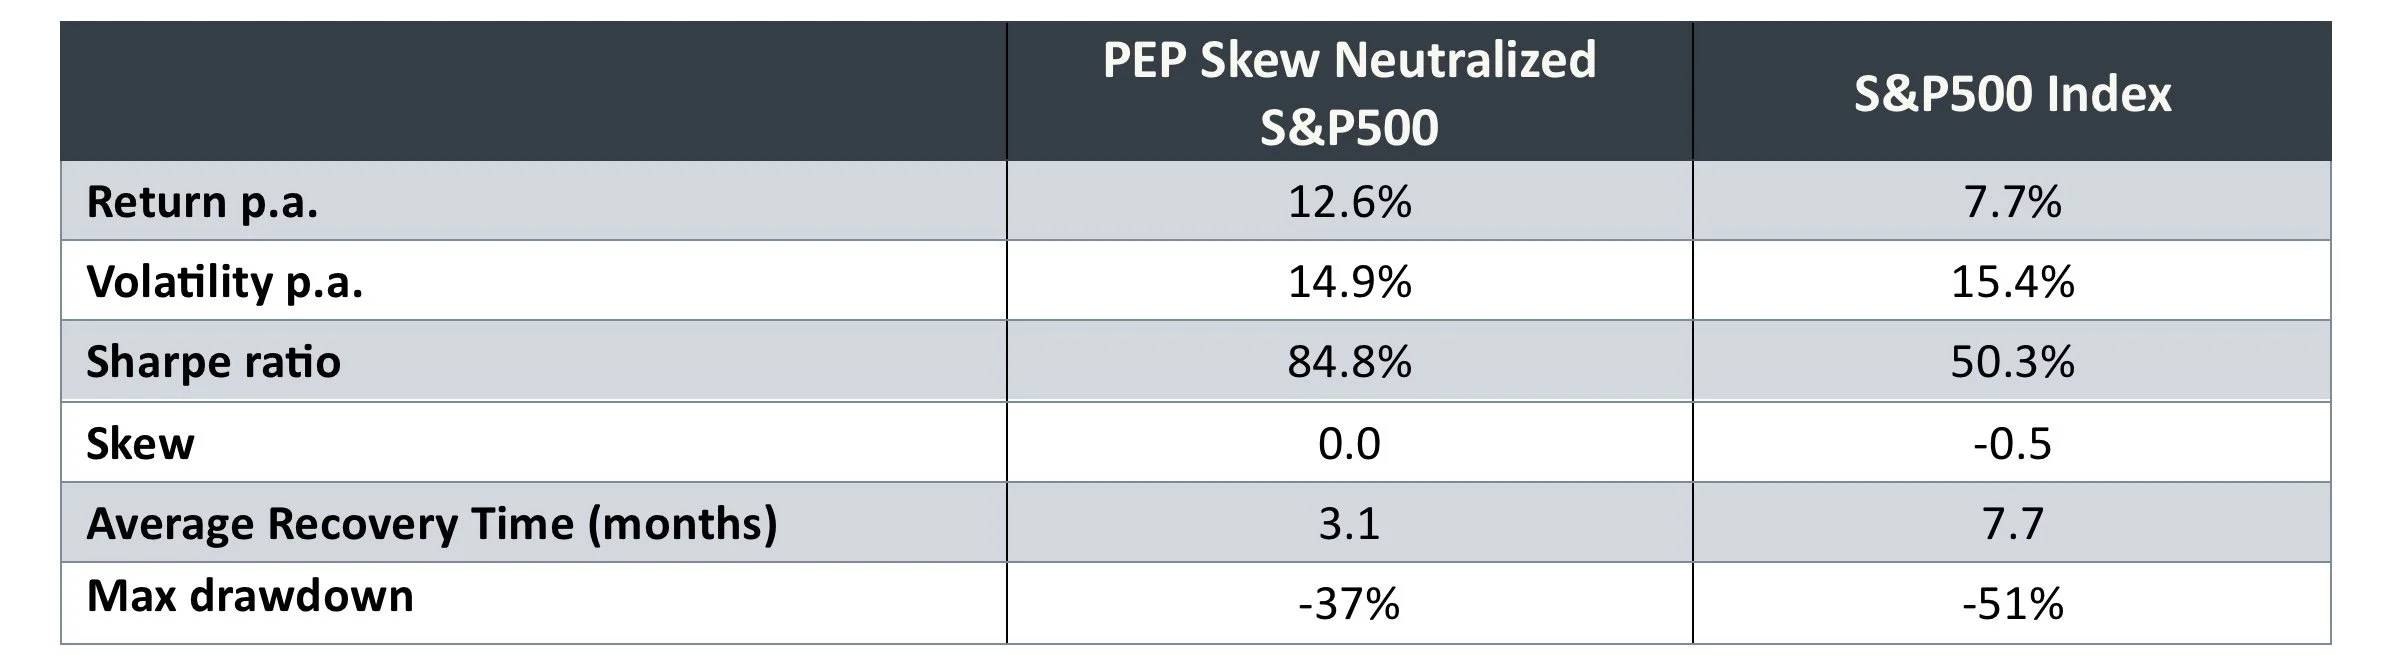
Source: PEP, Bloomberg. Skew neutralized S&P500 is based on the output of PEP proprietary models. Returns in USD. All performance taken from 01/01/2000 to 05/31/2024. Past and simulated performance is no indication of future results.
Clearly the results of the above portfolio are orders of magnitude better than an investment in the S&P500. An interesting follow on though is how this approach competes against a traditional diversified portfolio.
Is neutralizing skew more important than diversification?
In a previous paper, we started with a chart like the below. The curved line shows an efficient frontier made up from different allocations between equities (S&P500) and bonds (Bloomberg US Aggregate). The point at which the blue line touches the efficient frontier is theoretically the most efficient portfolio. It’s theoretically more efficient to mix this portfolio with cash, or to leverage it, to get to the risk level you want, rather than using any other combination of assets.
The skew neutralized S&P500 portfolio from above is represented by the dot. The fact that this sits comfortably above the tangent does support the argument that neutralizing the skew on equity markets is more efficient than the most efficient static portfolio of equities and bonds.
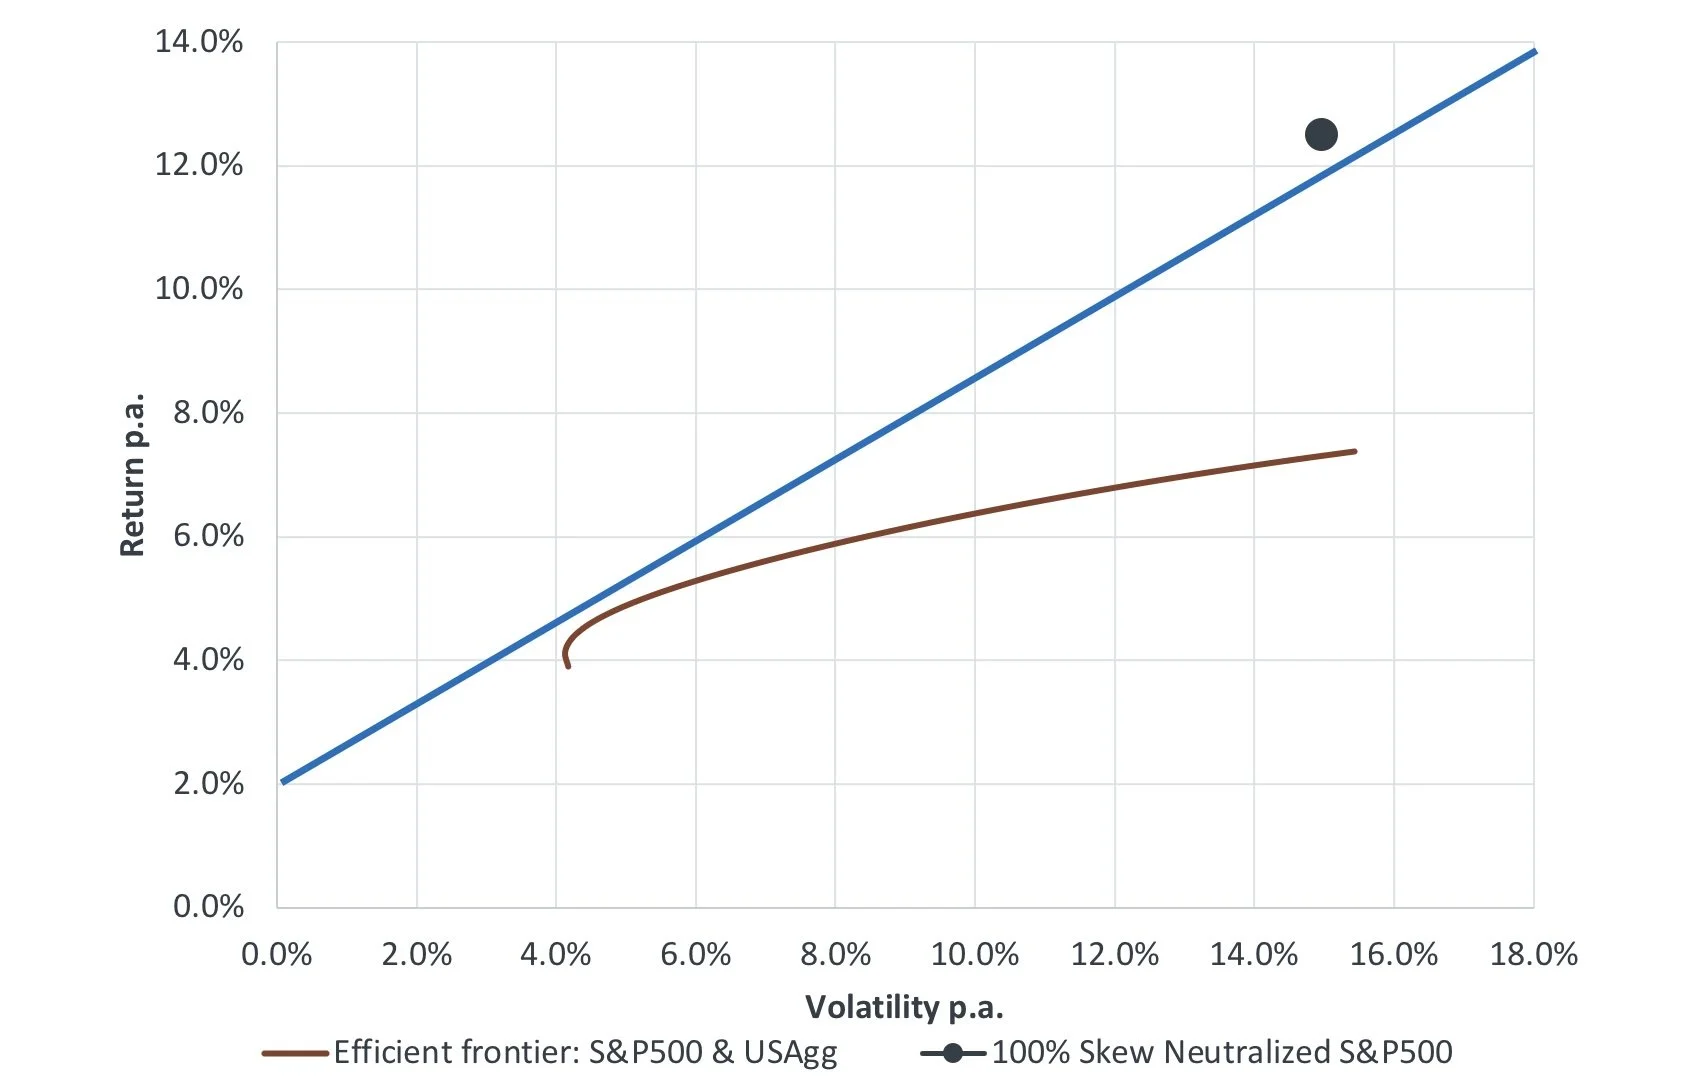
Source: PEP, Bloomberg. Skew neutralized S&P500 is based on the output of PEP’s proprietary models. Returns in USD. All performance taken from 01/01/2000 to 05/31/2024. Past and simulated performance is no indication of future results.
The difference in approaches is even more meaningful when we use recovery time as the basis for risk. The following chart illustrates this.
For an equivalent recovery time, the skew neutralized portfolio generates an additional 7% p.a. in return.
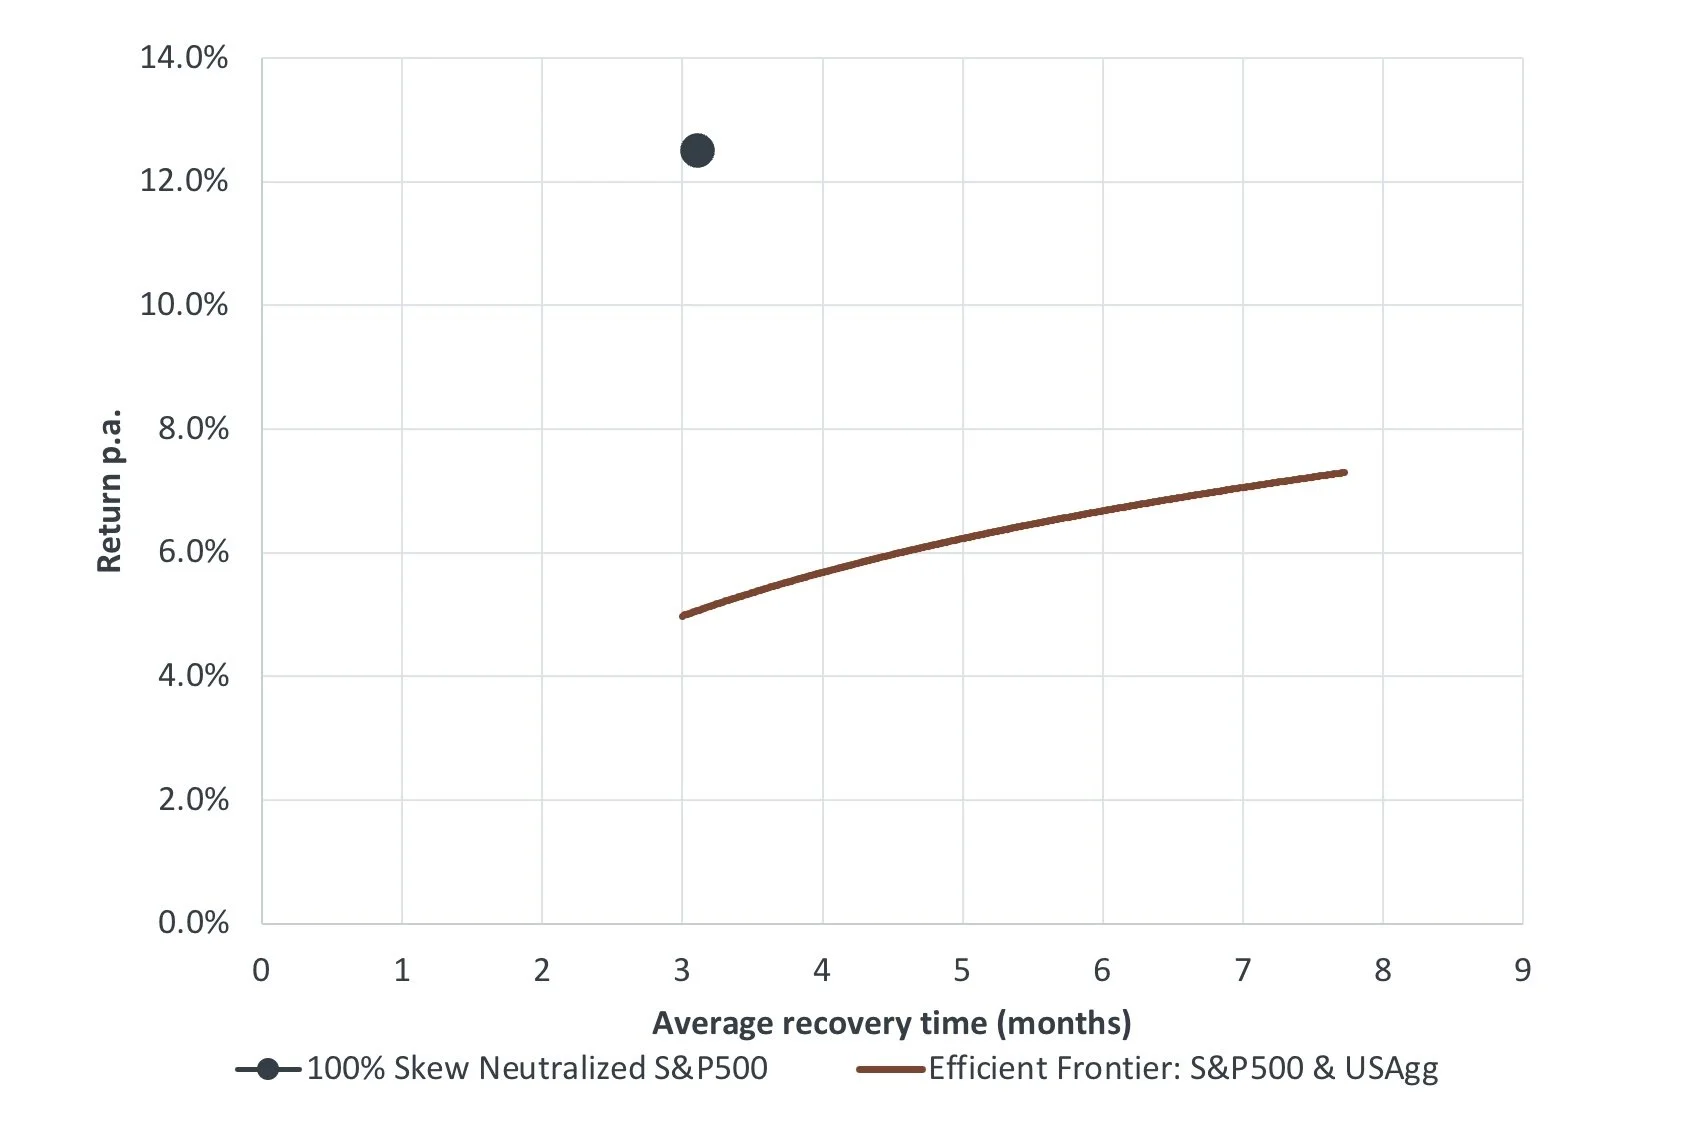
Source: PEP, Bloomberg. Skew neutralized S&P500 is based on the output of PEP’s proprietary models. Returns in USD. All performance taken from 01/01/2000 to 05/31/2024. Past and simulated performance is no indication of future results.
To be clear - we are not arguing against diversification. Rather we are saying the benefit of managing skew is so significant that the analysis suggests it is worth solving this problem before considering diversification. This is particularly the case if recovery time is a dominant measure of risk for an investor. Clearly if managing skew within public equities significantly reduces risk, then the degree of diversification required to manage down risk to the investor’s risk tolerance is less than it would be otherwise.
This is something we are seeking to address as a business.
Summary
The most effective way to increase portfolio skew is to decrease volatility on the downside and increase it on the upside.
In this paper we have highlighted some practical considerations to doing this, namely:
· The greatest source of negative skew within most portfolios is public equities. Addressing the negative skew problem is therefore best achieved through focusing on this class.
· Within equities this is best achieved through a combination of asset allocation and equity segment allocation.
· On the downside this should involve under allocating to equities and/or investment in quality/defensive equities.
· Even a relatively simple approach to managing skew can have an outsized effects on overall portfolio outcomes. We think investors should look to solve the skew problem in their equity portfolio before they consider diversifying.
PEP offers products that are designed to solve the skew problem for clients. We believe this is best achieved within public equities, as we have shown in this paper. We therefore offer a range of relatively high-performance strategies, that are managed to be risk/return efficient but also to deliver positive skew (and in doing so to neutralize portfolio skew for investors).
If you would like more information on these strategies please reach out to your PEP contact.
CONFIDENTIAL INFORMATION: The information herein has been provided solely to the addressee in connection with a presentation by Public Equity Partners LLC on condition that it not be shared, copied, circulated or otherwise disclosed to any person without the express consent of Public Equity Partners LLC.
INVESTMENT ADVISOR: Investment advisory services are provided by Public Equity Partners LLC, an investment advisor registered with the US Securities and Exchange Commission.
SIMULATED PERFORMANCE: The simulated performance was derived from the retroactive application of a model with the benefit of hindsight. Performance results do not represent actual trading. Performance does not include material economic and market factors that might have impacted the adviser's decision making when using the model to manage actual strategies. Performance does not reflect the deduction of advisory fees, brokerage or other commissions, mutual fund exchange fees, and other expenses a client may be required to pay.
PAST PERFORMANCE IS NOT AN INDICATION OF FUTURE RESULTS.
SECURITY INDICES: This presentation includes data related to the performance of various securities indices which may provide an appropriate basis for comparison with underlying investments and the client’s total investment portfolio. The performance of securities indices is not subject to fees and expenses associated with investment funds. Investments cannot be made directly in the indices. The information provided herein has been obtained from sources which Public Equity Partners LLC believes to be reasonably reliable but cannot guarantee its accuracy or completeness.
Issued by Public Equity Partners LLC