
Investment Seasons
Why investment seasons are key to understanding – and outperforming – the S&P500
Or why “ you can ignore macro, but macro won’t ignore you”
Everyone understands seasons, because we all live them and have done for years. Most investors can probably appreciate that there are seasons to investing. But what is less appreciated is how these seasons impact the ability of stock pickers to outperform, and how the seasons themselves present a much more effective way of outperforming.
Let’s start by defining the investment seasons, and then we’re going to use an actual seasonal analogy – based on harvests - to illustrate this in practice. This analogy is so strong that we’ve started referring to the investment seasons based on the harvests. The consistency is remarkable.
Most investors would recognise four seasons. One can argue for more, but our analysis – with which we won’t distract here – tells there are four distinct seasons, not more, not less. They are:
- Recovery – markets lift strongly, usually off the back of a market fall
- Expansion – markets lift and the economy has momentum, typically lifting commodity prices
- Slowdown – the economy is still expanding by decelerating, but generally markets are rising.
- Downturn – markets fall, usually significantly, and mostly this is related to something economic like higher expected interest rates or very weak economic performance.
Let’s turn quickly now to look at how historically harvests operated, and then make use of the analogy to understand some important features of the S&P500.
Harvest Seasons
Interestingly enough, the series of harvests throughout the year create four distinct seasons. To the point that Biblical Festivals were linked to them.
The first harvest in the year was Barley, and it would generally occur around the same time as Passover. Barley as a crop required less threshing than the other crops, so in a sense it’s easier to “harvest”.
The next Harvest was wheat. Generally, this would coincide with Pentecost (around 50 days later – hence the name) and as a result that Festival would celebrate the Harvest.
The third harvest was grape. This tends to be in the fall and would coincide with three Festivals – Feast of Trumpets, Day of Atonement and Festival of the Booths (Tabernacles) which are all relatively close together. The grape harvest, in so much as it is used for wine, requires more work to harvest and has more waste to remove through trampling the grapes. But the ultimate harvest is good!
The Festival of booths as the last of the year’s festivals (or at least the original festivals before the festival of lights was introduced after the Jews overcame Antiochus IV) is all about water. Which brings us to the last season, winter. There is no crop in winter, but the rain is necessary to set up the crop for the following year. Hence winter is simply a necessary part of the cycle.
The seasonal process of harvests – barley, wheat, grape and winter – correspond remarkably well to what we see in markets.
Barley – Recovery
When a recovery comes, generally after some kind of downturn, the key is simply to know what investment “field” you need to be in. Don’t go to the wheat field or the vineyards. If you’re in the right field, the harvest will take care of itself – recovery stocks as a group do extremely well - higher beta assets and those that have recently been out of favour.
Wheat – Expansion
Similarly, when we get to the expansionary season, it’s important to be in the right field – which in this case is those companies that are commodity exposed. But a bit of work is required to separate the wheat from the chaff. Not tons of work, but some. What remains usually performs very well.
Grape – Slowdown
In Slowdown, we have an environment where growth tends to dominate. So being in the growth “field” clearly helps. However, to make the most of it, quite a bit of concentrating is needed, and a focus on quality – so this harvest in a sense requires the most work, because the market breadth narrows considerably.
Winter - Downturn
The correspondence between these two is very close. From an investment perspective it’s cold and rainy. You want to be in the part of the market that is least cold (meaning least volatile), preserving capital and sometimes making money. Importantly though, without winters, you don’t get recoveries - the strongest point in the cycle.
There are two areas where it is important to know the analogy can break down, as all analogies do:
· Each investment season typically lasts much longer than the harvest season - the investment seasons vary in length but can easily be a year, sometimes longer
· The harvest seasons follow each other regularly, but the investment seasons can come in different orders and every once in a while, reverse.
But generally, the principles that the season idea illustrates is very helpful in understanding the S&P. We turn to this now.
The structure of the S&P500
We are actually able to attach the stocks in the S&P to their relevant season. The S&P’s allocations by season are shown in the table below.
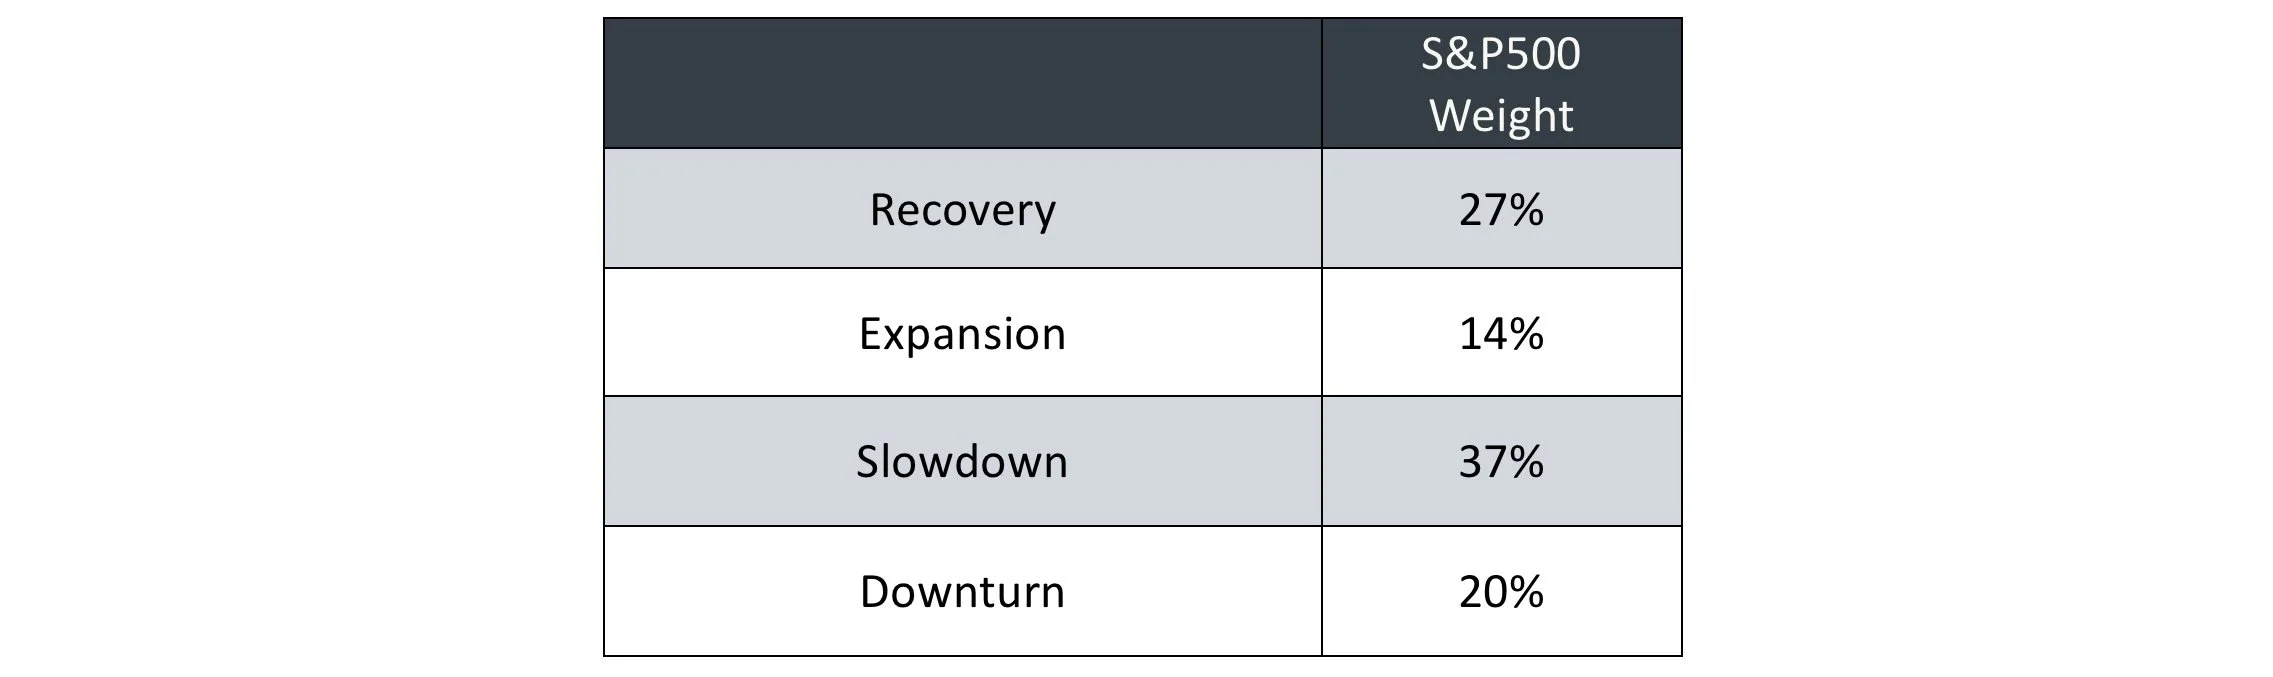
Source: PEP as at 03/31/2025. Table is based on the S&P500 market cap weighted index and shows output from PEP’s proprietary models. PAST AND SIMULATED PERFORMANCE IS NO INDICATION OF FUTURE RESULTS. Numbers add up to more than 100% because stocks can appear in multiple segments.
Notice how balanced it is across the various seasons. This is even more obvious when compared to the rest of the world, as shown in the table below.
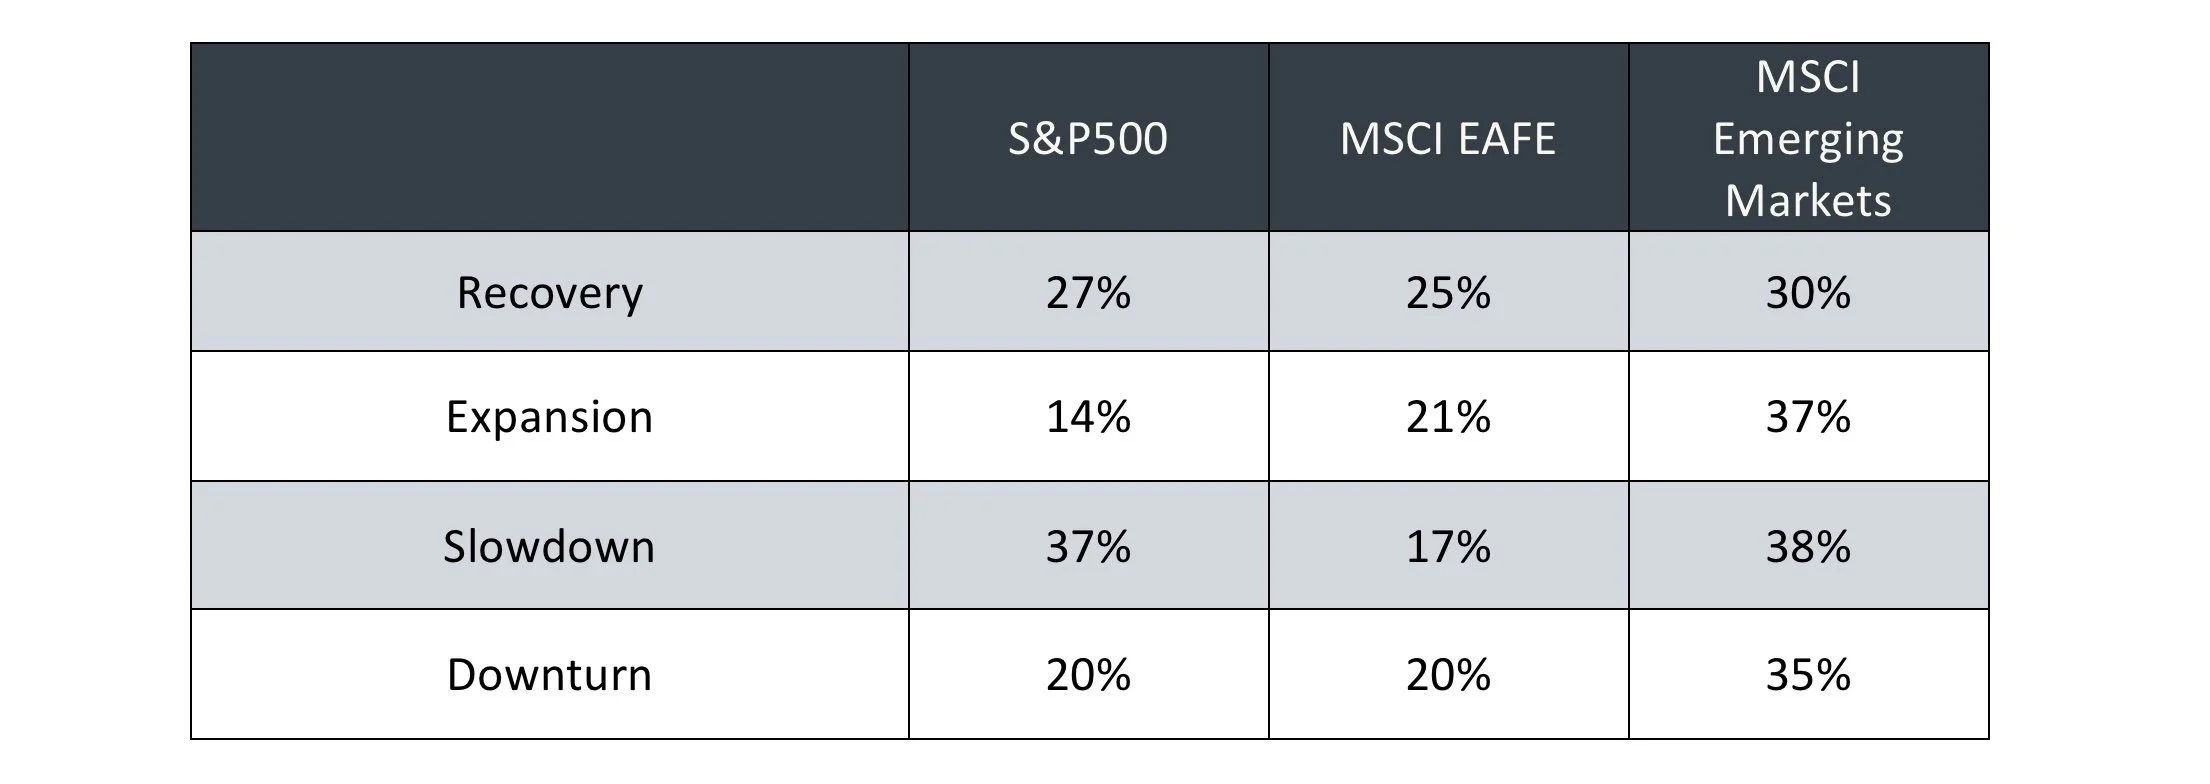
Source: PEP as at 03/31/2025. Table is based on the S&P500, MSCI EAFE and MSCI Emerging Market indices and shows output from PEP’s proprietary models. PAST AND SIMULATED PERFORMANCE IS NO INDICATION OF FUTURE RESULTS. Numbers add up to more than 100% because stocks can appear in multiple segments.
This balance is key to understanding why the S&P is so effective through time – it is not overexposed to any particular season and therefore its balance is a great strength compared to the rest of the world. We see this especially when we look at EPS growth on the S&P compared to the rest of the world, where the effect of commodity performance on earnings is far greater.
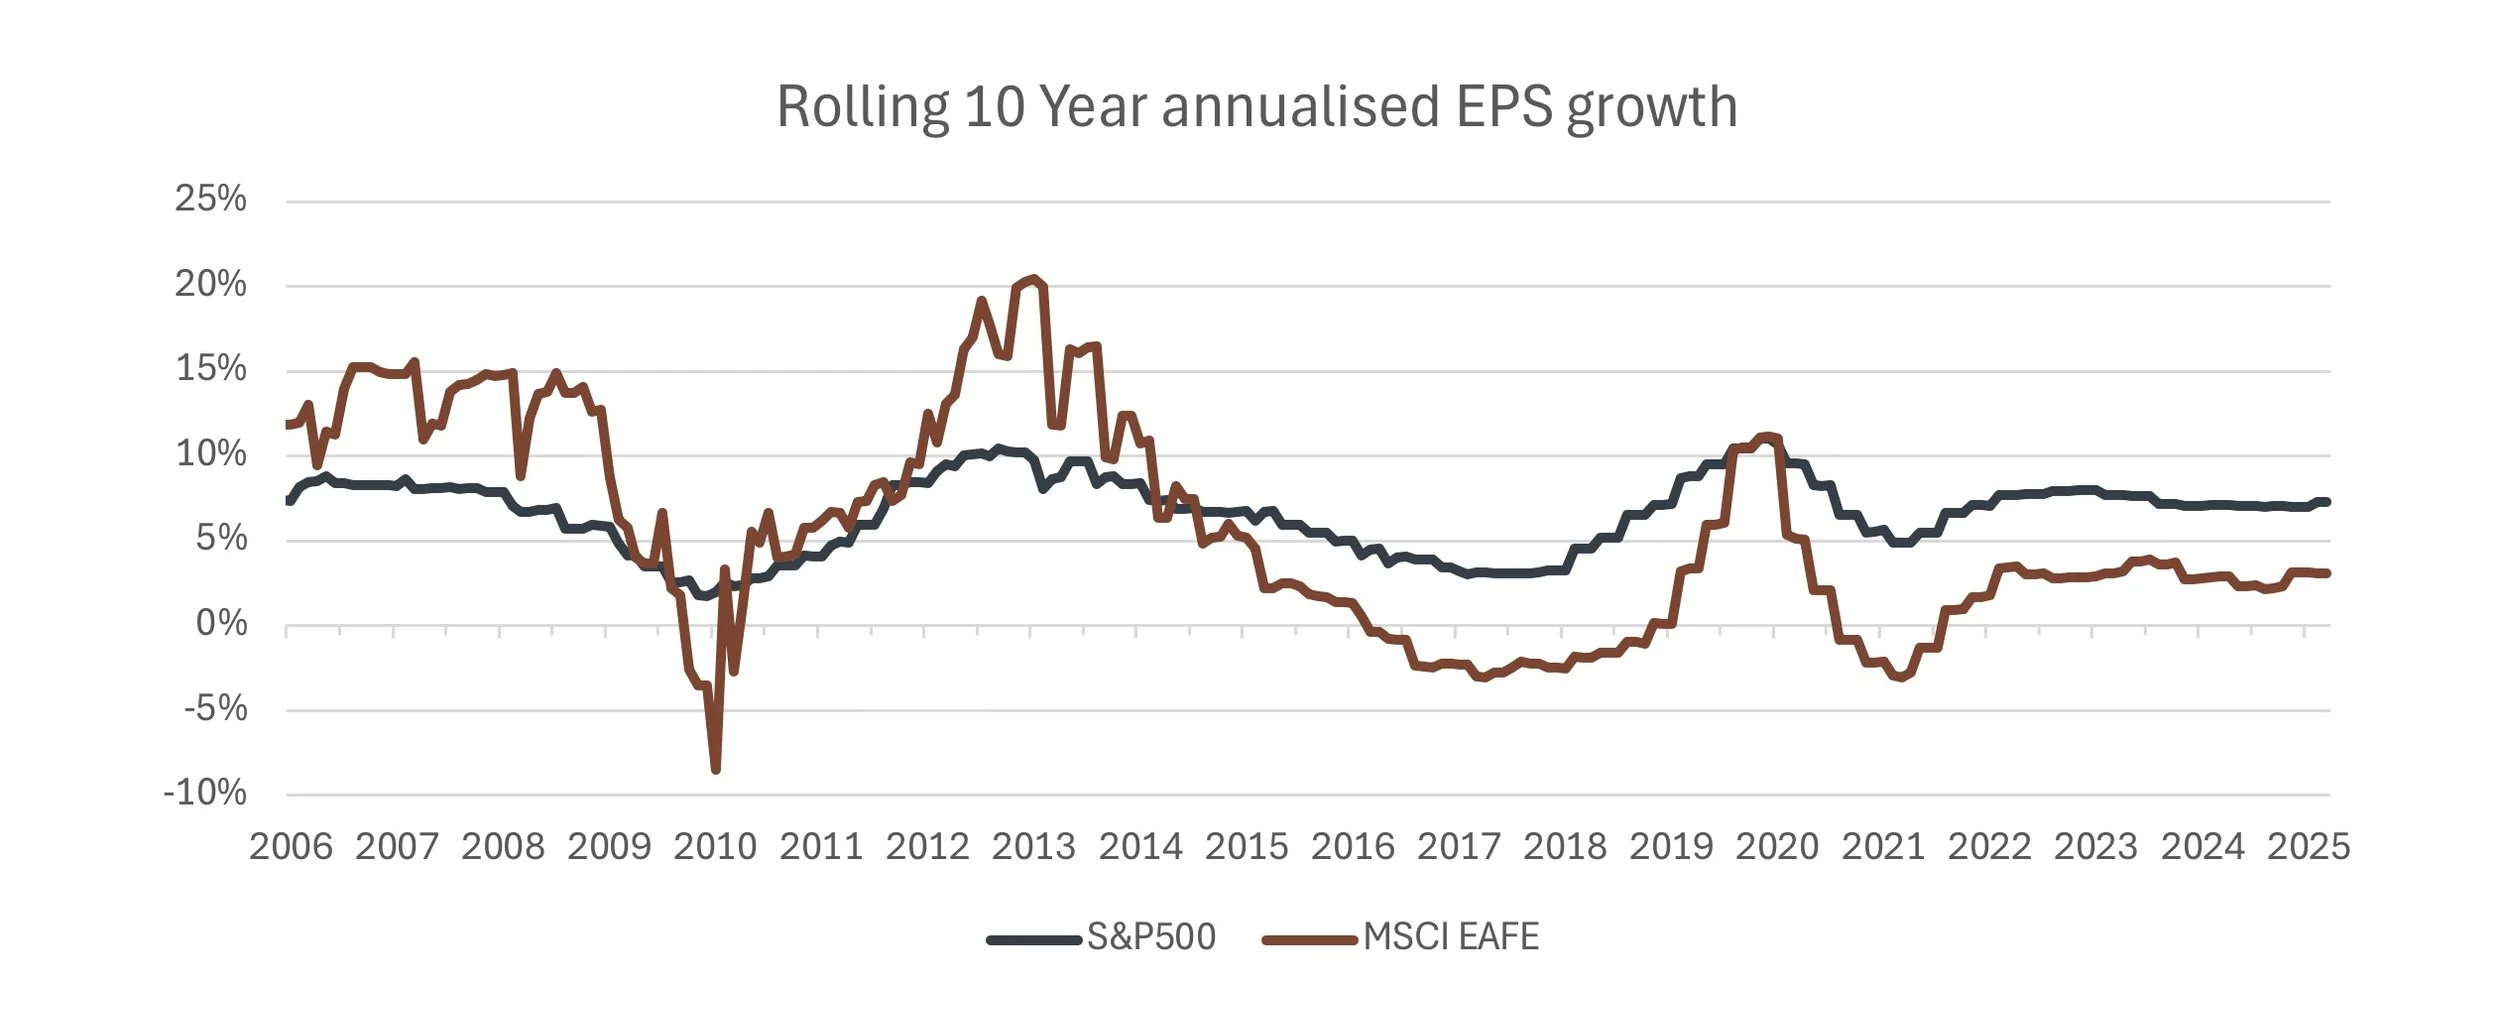
Source: Bloomberg from 04/01/1995 to 03/31/2025. PAST AND SIMULATED PERFORMANCE IS NO INDICATION OF FUTURE RESULTS.
This EPS growth stability is a key reason why the S&P is so successful through time.
That the S&P is a good investment doesn’t, however, explain why it’s so hard to outperform by picking stocks. But the seasons do…
The table below shows for each of the seasons – and the rest of the S&P that is not in season - the percentage of the market cap that is outperforming, along with the number for the S&P as a whole.
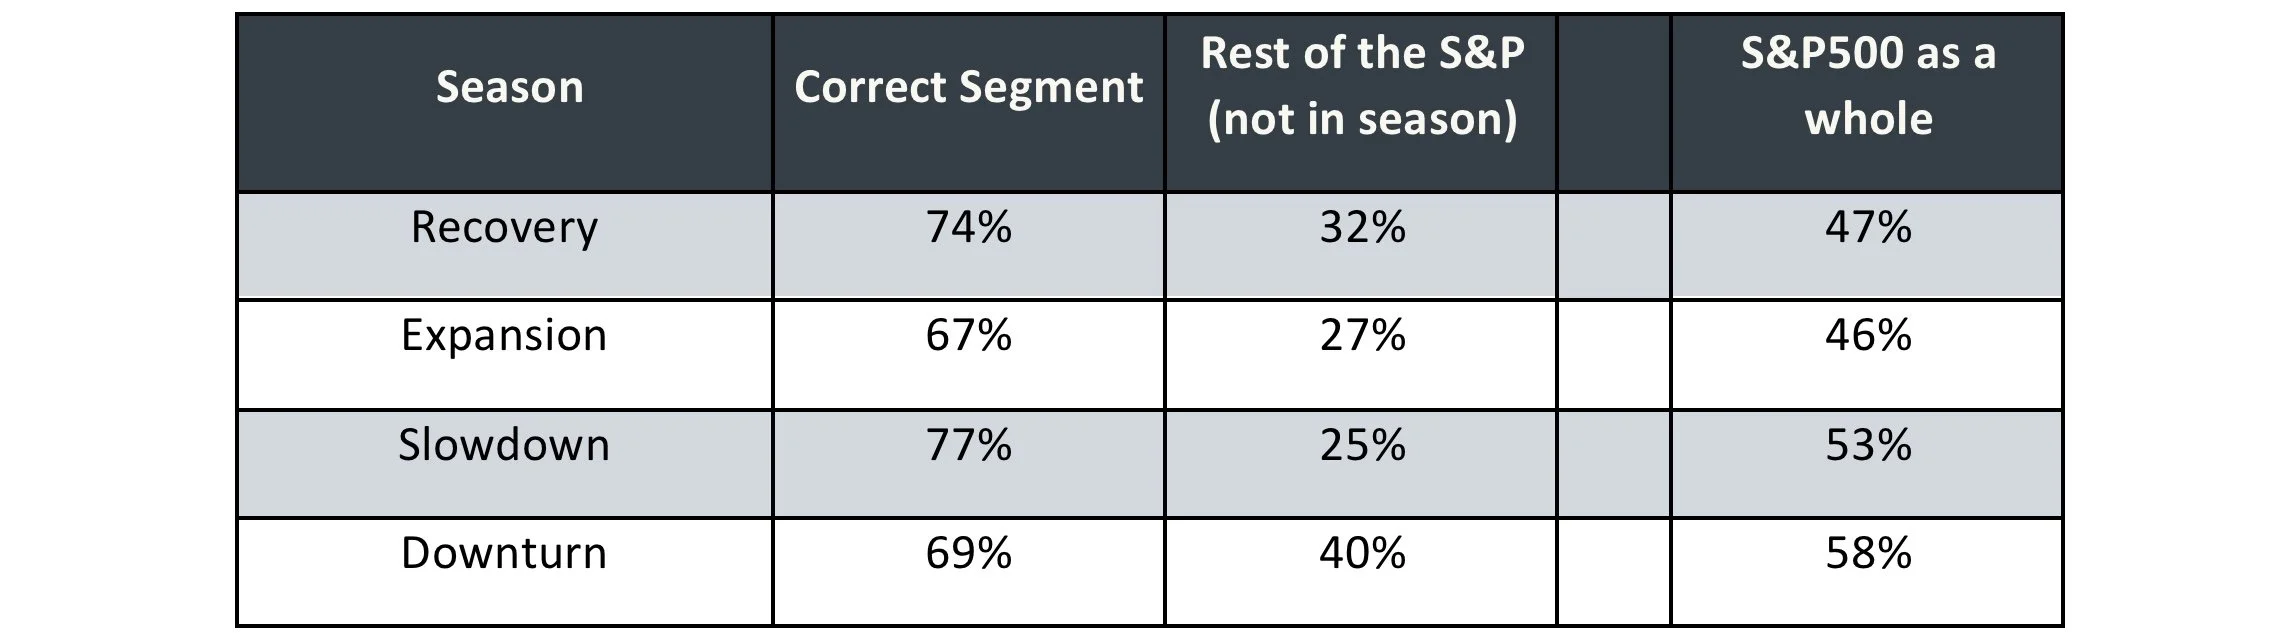
Source: PEP from 02/28/2009 to 12/31/2022. All returns in USD. Chart shows the output from PEP’s proprietary models. PAST AND SIMULATED PERFORMANCE IS NO INDICATION OF FUTURE RESULTS.
What can be seen is the massive effect of the seasons on the probability of outperforming. We have done this by market cap, rather than individual stock names, because in practice the vast majority of managers are affected by market cap through tracking error constraints. The same story holds when looked at as a % of individual stock names though.
This shows the big problem stock pickers face – if you are not harvesting in the correct season, the chance of you outperforming is way less than evens. It is analogous to harvesting wheat or grape in the barley season – they aren’t ready yet and therefore they won’t have value. The key thing about selecting stocks is that they are in season.
What we are saying is that the seasonal effect is so strong that it distorts everything. It is why we say “you can ignore macro, but macro won’t ignore you”. The macro environment drives the seasons, and the seasons in turn drive the stock performance. Therefore the single most important decision any investor will make is not the stock decision but which season we are in, and what therefore we should be harvesting.
The table below illustrates the return by season. As can be seen, there is a very large amount of excess return to be had through understanding the seasons.
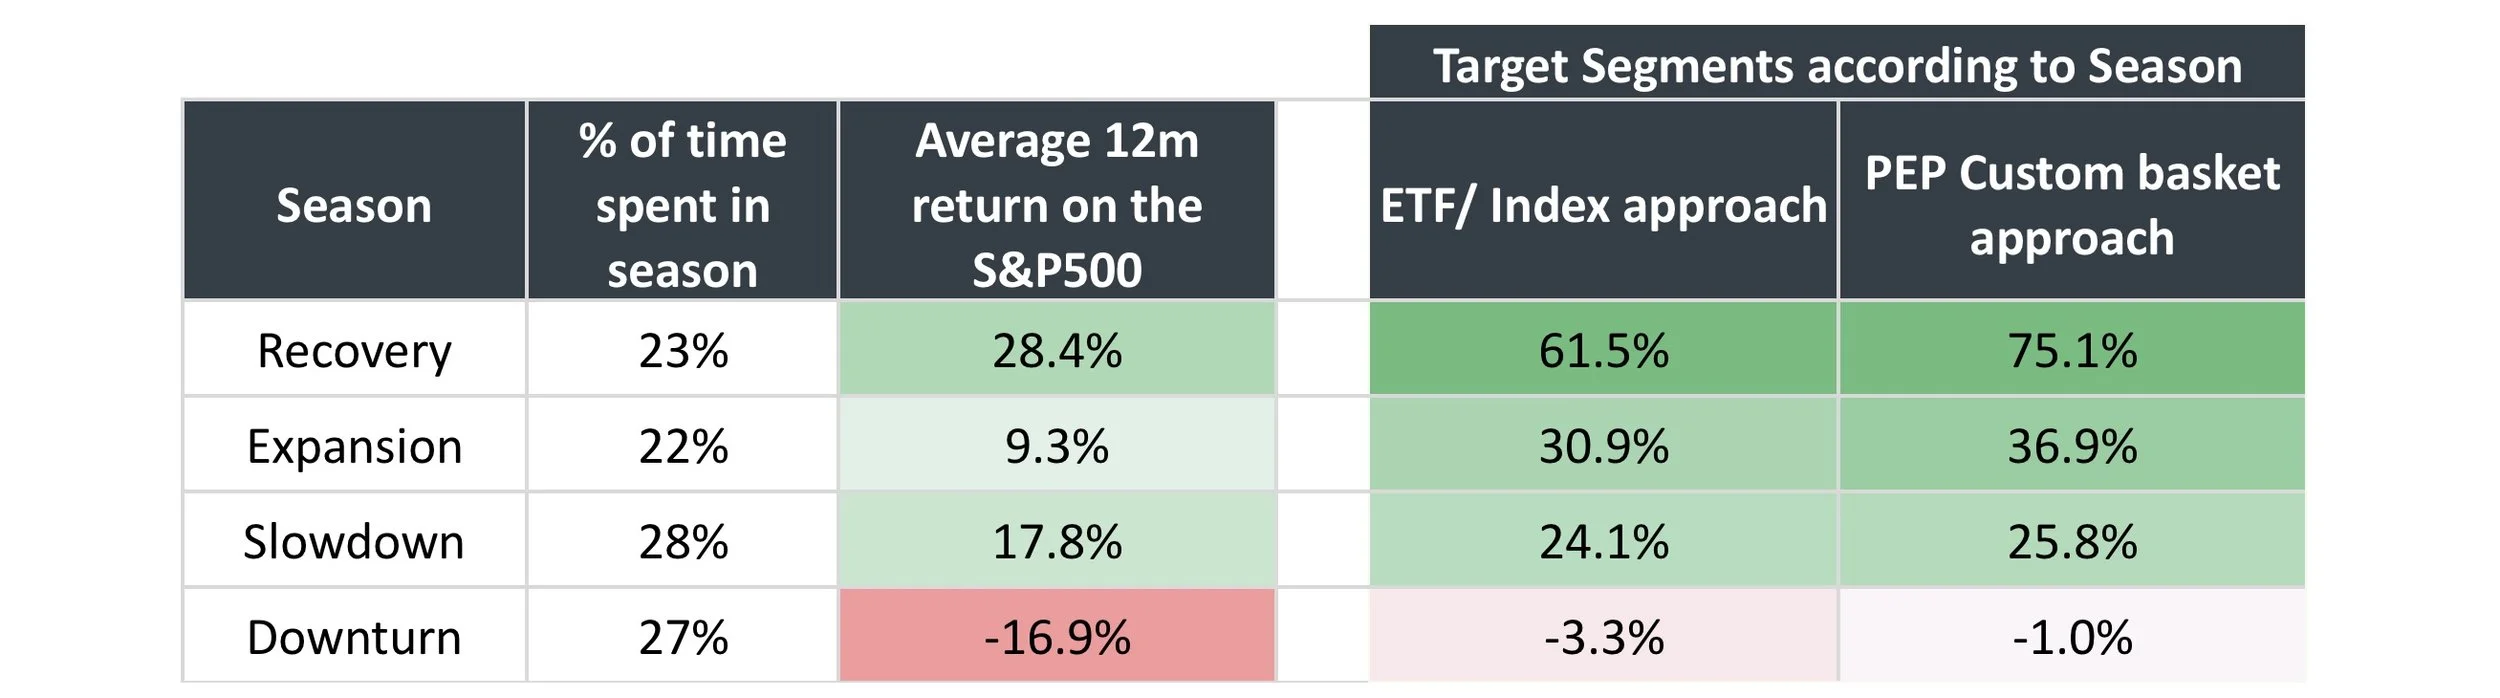
Source: PEP from 06/30/1999 to 03/31/2025. All returns in USD. Table shows the output from PEP’s proprietary models. PAST AND SIMULATED PERFORMANCE IS NO INDICATION OF FUTURE RESULTS. Target Segment according to Season shows a different asset for each Season based on PEP’s proprietary models.
Concluding thoughts
In this paper, we have made the case that understanding the seasons, in the same way as understanding the harvests, is key to appreciating the strength of the S&P and why it is so difficult to outperform for stockpickers. Equally, an approach that starts with the seasons has a stronger advantage for generating excess returns, by harvesting the right crop at the right time.
CONFIDENTIAL INFORMATION: The information herein has been provided solely to the addressee in connection with a presentation by Public Equity Partners LLC on condition that it not be shared, copied, circulated or otherwise disclosed to any person without the express consent of Public Equity Partners LLC.
INVESTMENT ADVISOR: Investment advisory services are provided by Public Equity Partners LLC, an investment advisor registered with the US Securities and Exchange Commission.
SIMULATED PERFORMANCE: The simulated performance was derived from the retroactive application of a model with the benefit of hindsight. Performance results do not represent actual trading. Performance does not include material economic and market factors that might have impacted the adviser's decision making when using the model to manage actual strategies. Performance does not reflect the deduction of advisory fees, brokerage or other commissions, mutual fund exchange fees, and other expenses a client may be required to pay.
PAST PERFORMANCE IS NOT AN INDICATION OF FUTURE RESULTS.
SECURITY INDICES: This presentation includes data related to the performance of various securities indices which may provide an appropriate basis for comparison with underlying investments and the client’s total investment portfolio. The performance of securities indices is not subject to fees and expenses associated with investment funds. Investments cannot be made directly in the indices. The information provided herein has been obtained from sources which Public Equity Partners LLC believes to be reasonably reliable but cannot guarantee its accuracy or completeness.
Issued by Public Equity Partners LLC